The American Gaming Association’s (AGA) Commercial Gaming Revenue Tracker features monthly and year-to-date gross gaming revenue (GRR) at a state and national level, broken down by individual gaming verticals.
July Commercial Gaming Revenue
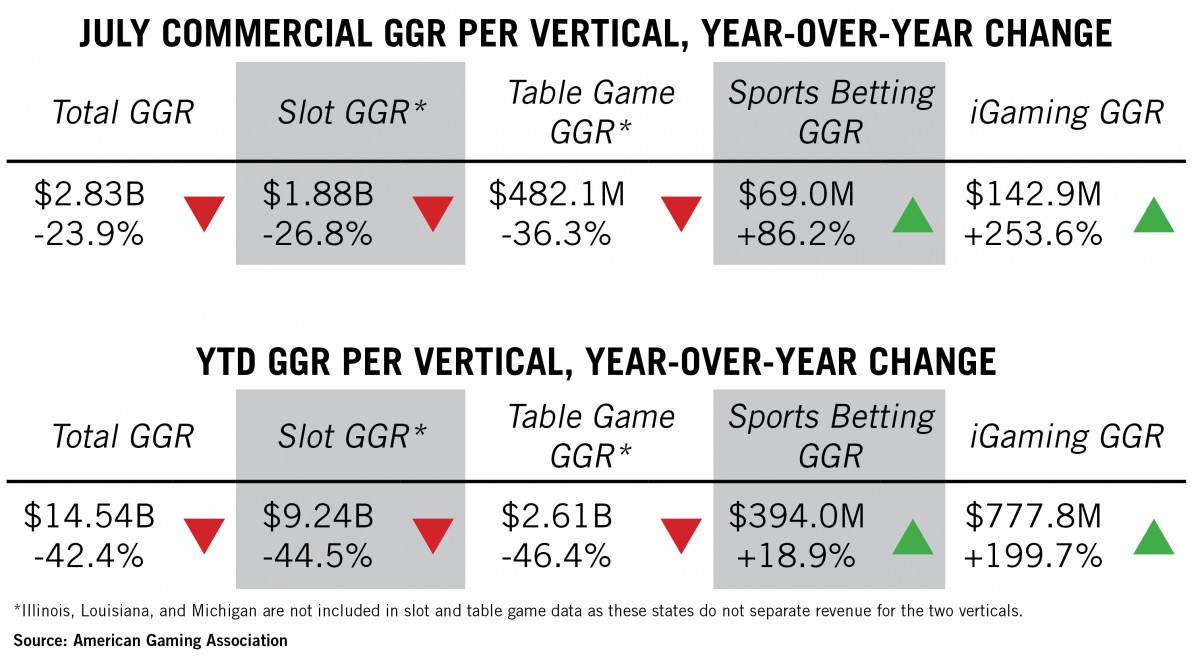
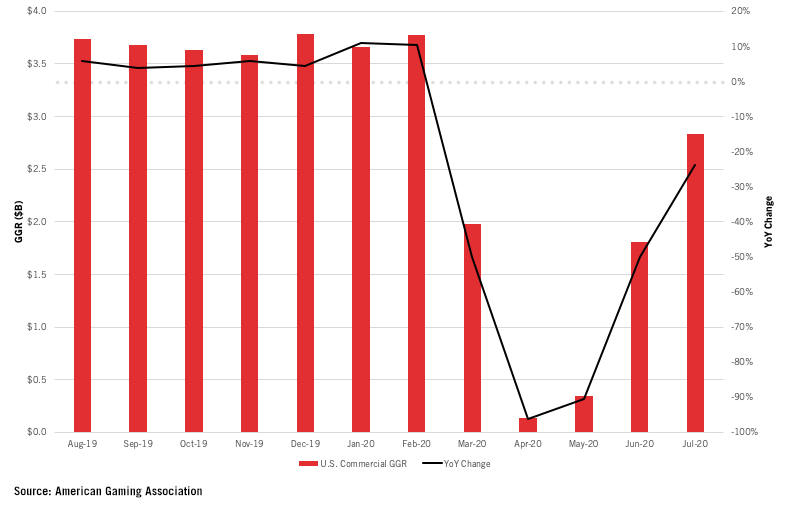
In July, national commercial gaming revenue continued to recover from lows in April and May, the height of the industry’s COVID-19-related shutdown. While July revenue was down 23.9% year-over-year, it was the third straight month of dramatically improving revenue conditions for commercial gaming. Thirty-two commercial casinos partially reopened throughout July – including all properties in Illinois, Maine, Massachusetts, and New Jersey – while 50 remained closed at month’s end.
Even as all commercial properties remained shuttered in major gaming states like New York and Michigan, commercial casinos generated more gaming revenue in July than in the three preceding months combined.
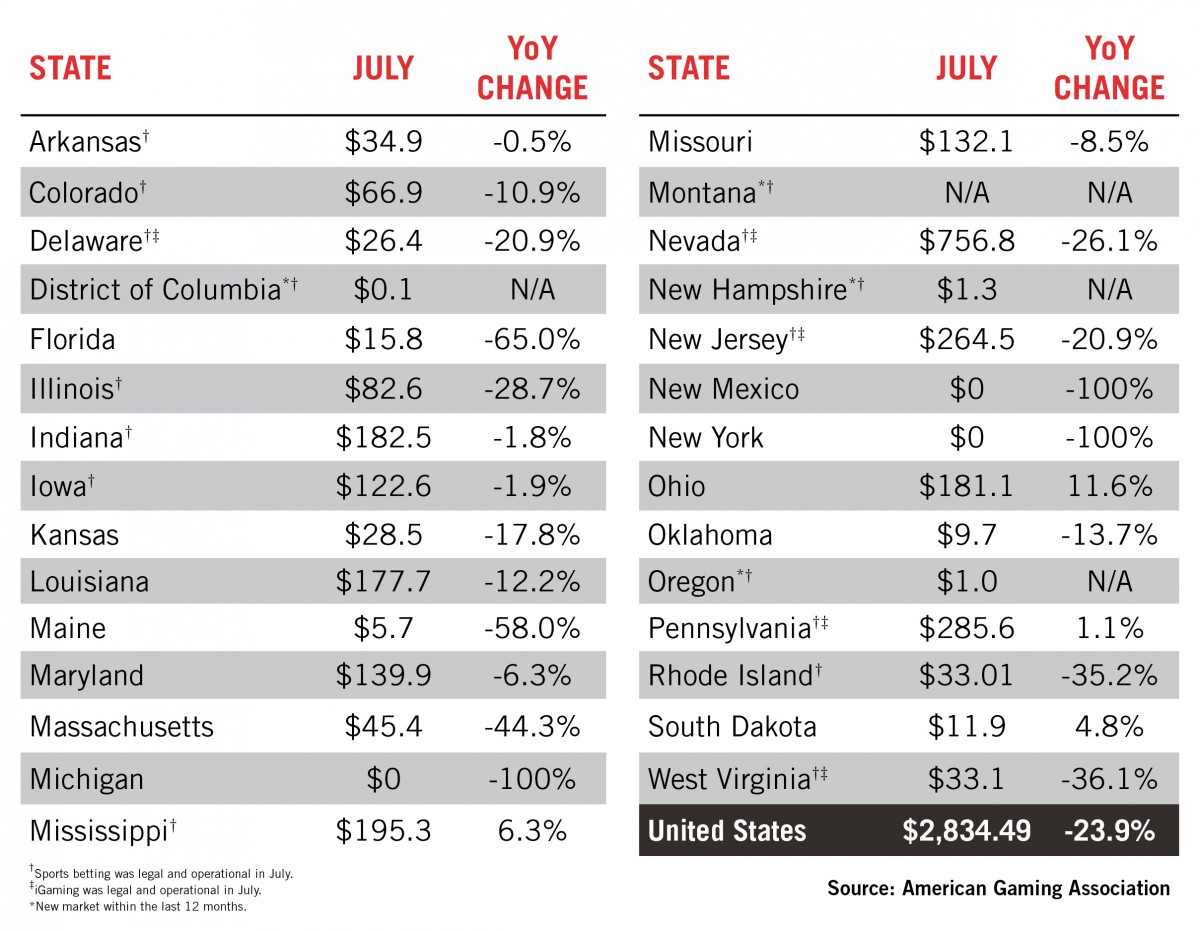
Many gaming states recorded strong revenue figures for July despite continuing to operate with limited capacity, game availability, and amenities. Ohio reported its highest monthly gaming revenue on record, while Mississippi, Pennsylvania, and South Dakota outperformed July of last year and six other states saw gaming revenue down by only single digit percentages.
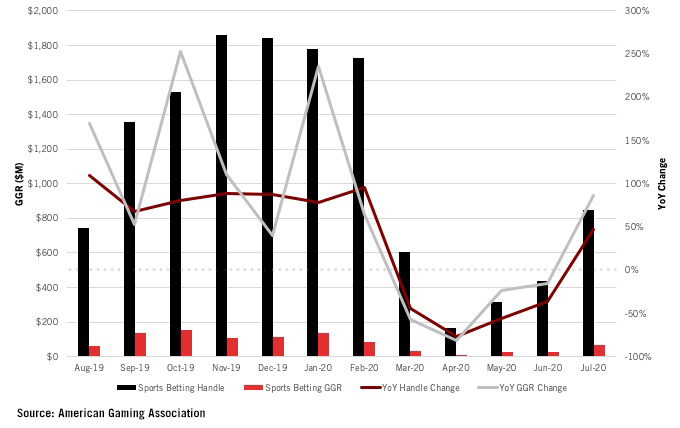
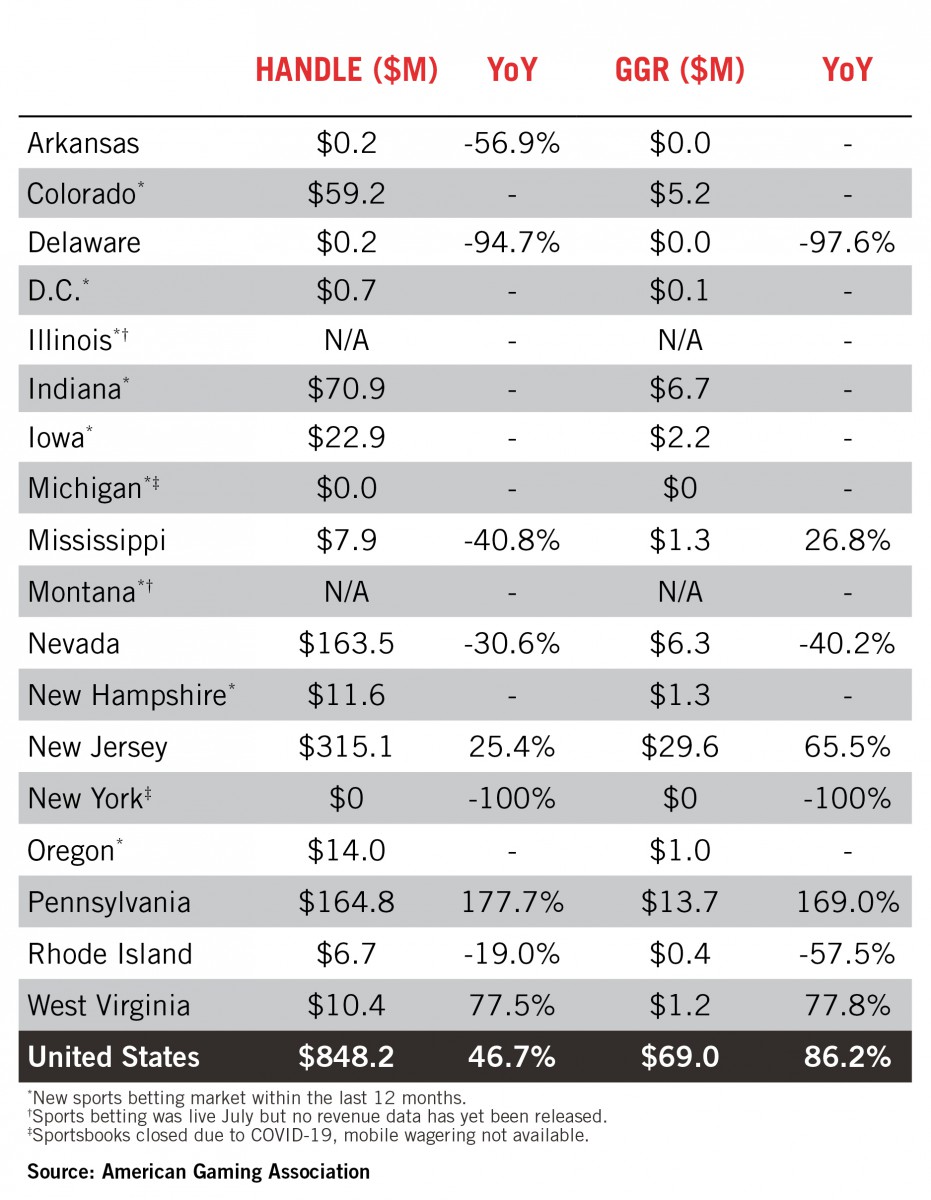
Sports betting revenue is up 18.9 percent in 2020 compared to the same period last year while the total amount wagered has increased 3.2 percent. Much of this growth is attributable to the opening of nine new markets in the last 12 months.
About the Report
AGA’s new Commercial Gaming Revenue Tracker provides state-by-state and cumulative insight into the U.S. commercial gaming industry’s financial performance. Monthly updates on AmericanGaming.org feature topline figures based on state revenue reports while quarterly reports provide a more detailed analysis covering the three previous months.